INTRODUCTION
In the simple Keynesian model, the aggregate supply (AS) curve with variable price level is inverse L-shaped.
The AS curve is horizontal up to the full-employment level of output.
Beyond the full-employment level, the AS curve becomes vertical.
During recession or depression.
There is excess capacity, unemployment of labour, and idle capital stock.
The aggregate supply curve is perfectly elastic.
Increase in aggregate demand leads to increase in real national output and employment.
The price level remains unchanged.
There is no inflationary cost of increasing output.
At full employment.
The aggregate supply curve becomes perfectly inelastic (vertical).
Further increase in aggregate demand cannot increase output.
It only causes a rise in the price level.
Inflation occurs only after full-employment output is reached.
Therefore.
In the simple Keynesian model, there is no trade-off between inflation and unemployment.
Before full employment, output can increase without inflation.
After full employment, only inflation increases, not output.
INFLATION-UNEMPLOYMENT TRADE-OFF: PHILLIPS CURVE
The simple Keynesian macro model did not fit well with actual empirical evidence.
A. W. Phillips published a research article in 1958 based on historical data from the United Kingdom.
He found an inverse relationship between the rate of unemployment and the rate of inflation.
This inverse relationship implies a trade-off between inflation and unemployment.
To reduce unemployment, a higher rate of inflation must be accepted.
To reduce inflation, a higher rate of unemployment must be tolerated.
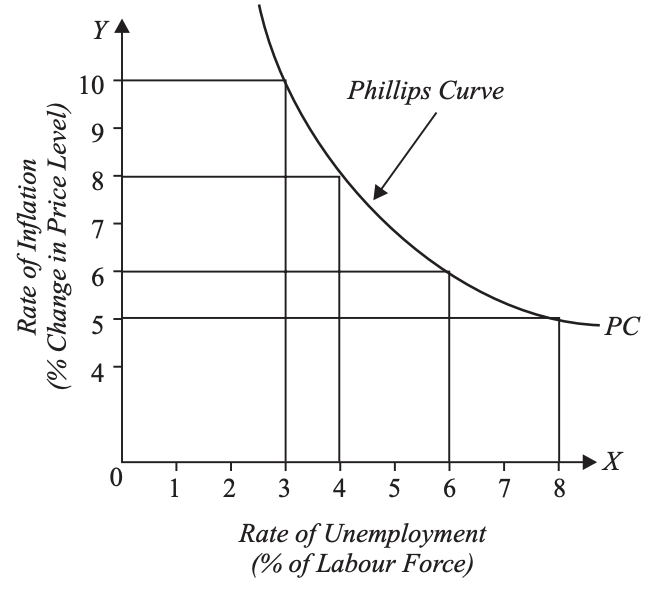
The downward-sloping curve showing this inverse relationship is called the Phillips Curve.
In the Phillips Curve.
The horizontal axis measures the rate of unemployment.
The vertical axis measures the rate of inflation.
Higher inflation is associated with lower unemployment.
Lower inflation is associated with higher unemployment.
Empirical data from the 1960s in the United States also supported the inverse relationship.
Similar evidence from other developed countries in the 1950s and 1960s confirmed the Phillips Curve concept.
Many economists believed in a stable Phillips Curve showing a predictable trade-off.
This created a policy dilemma for economic policymakers.
Choose higher inflation with lower unemployment.
Or choose lower inflation with higher unemployment.
However, the concept of a stable Phillips Curve broke down during the 1970s and early 1980s.
During this period, the USA and Britain experienced both high inflation and high unemployment simultaneously.
This phenomenon contradicted both the Phillips Curve and the simple Keynesian model.
The simultaneous existence of high inflation and high unemployment is called stagflation.