
Introduction
- A map may be defined as the representation of the earth’s surface with standard signs, drawn to a scale so that each and every point on it corresponds to the actual position or things on the ground. Every sign, symbol and letter of a map have different meanings. It is thus very important to know and understand the symbols used on a map.
- Map-making techniques, also known as cartographic techniques, refer to the scientific methods used to represent the Earth’s surface or a part of it on a flat surface. These techniques enable the conversion of real-world geographic information into maps that are accurate, readable, and useful. Map-making plays a crucial role in geography, planning, navigation, environmental studies, and research.
- Map-making techniques constitute a systematic process of collecting, selecting, classifying, and presenting geographic information in map form. The methods aim to simplify the complex real-world environment while still maintaining some level of accuracy and clarity. Maps are not mere drawings but are, in fact, scientifically designed instruments for the effective communication of spatial information. Hence, understanding the concept of map-making becomes very important for the correct interpretation of maps in both academic and practical settings.
 Purpose of a Map
- The map shows many things about a continent, country, or surroundings that we live in. A map of your town can show the house you live in or the school you go to. But it is not possible to show everything on a single map.
- So, different indexes are used on a map to represent different things. Sometimes we use different shades or colors. For example, we can use a green shade to represent a forest area.
- Map-making techniques are important because they help in visualising spatial data and understanding relationships between geographic features. They are used by geographers, planners, administrators, and researchers.
Map-making techniques serve multiple academic and practical purposes. Their importance lies in their ability to simplify complex spatial information.
- Help in spatial understanding and analysis
- Support planning and policy-making
- Assist in navigation and location identification
- Aid environmental and resource management
- Improve the communication of geographic data
Elements of a Map
The following elements are essential components of any map.
Element | Purpose |
Title | Explains the subject of the map |
Scale | Shows the relationship between map and ground distance |
Direction | Indicates orientation, usually north |
Symbols | Represent geographic features |
Legend | Explains the meaning of symbols |
Source | Indicates data origin |
Different Mapping Techniques
There has been a drastic change in mapping the world with development in information technology. Some techniques used in map making are as follows:
- Independent Mapping Technique: Nearly everyone uses this technique for beginning a map making. In this technique, the map is made by studying an existing map and tracing it exactly. The maps can be inaccurate for a few times, but one can get acclimated after a while.
- Carbon Paper Mapping: This method uses carbon paper to copy the map exactly from an existing map.
- Tracing: The lower portion of the table is fitted with a glass and light is connected to the The base map is put in the glass and the new map is traced on a plain paper.
- Photocopying: The original map is photocopied in a machine. This method only copies the map and doesn’t provide any skill to the person.
- Overhead Projection (OHP) or Light Method: An OHP machine projects the map made in a clear plastic onto the wall and the new map is made using that. This method is not much in use these days.
- Stencil Method: In this method, the necessary map trace is made in stencil paper. Then the copies are made using a Stencil Machine. This method is also not much in use these days.
- Area Method: The original map is made on a paper with squares of equal area. Another map is made looking at the original lines in each box and traced exactly. After completion of the process, the map is ready.
- GIS Method: This is special method where computer software is used to draw a map and is the most used method of map making in the world.
- Template Method: In this method, a map is cut and turned into a block or frame. The block is then placed firmly on a plain paper and map is drawn around the block.
Any method used to draw a map is acceptable, and necessary details need to be filled in order for the map to be usable. A map is a universal language and the details need to be filled in according to the international standards.
Modern Practical Mapping Technologies
- With increase in use and development of technology every sector is getting more accurate and powerful methods for their betterment. Mapping is also dependent on some modern technologies which have made it easier, accurate and clearer.
Geographical Information System (GIS)
- This method communicates with the satellites in earth’s orbit and special computer software. The information received from the satellites is used to generate accurate maps.
- Mapping is done by processing the information collected from the satellites. The mapping method has been modernized because of this method, as the data is accurate and clear.
Global Positioning System (GPS)
- We can find certain location information on earth with the aid of satellite support and some devices. And so on the basis of that information, any area can easily be mapped.
- We can receive the latitude, longitude, altitude, etc. and use those basic facts to draw the map. Apart from these systems, computers and mobile communication software use Google Earth and GPS as the modern geographic information sources.
UBD MAP SYMBOLS:
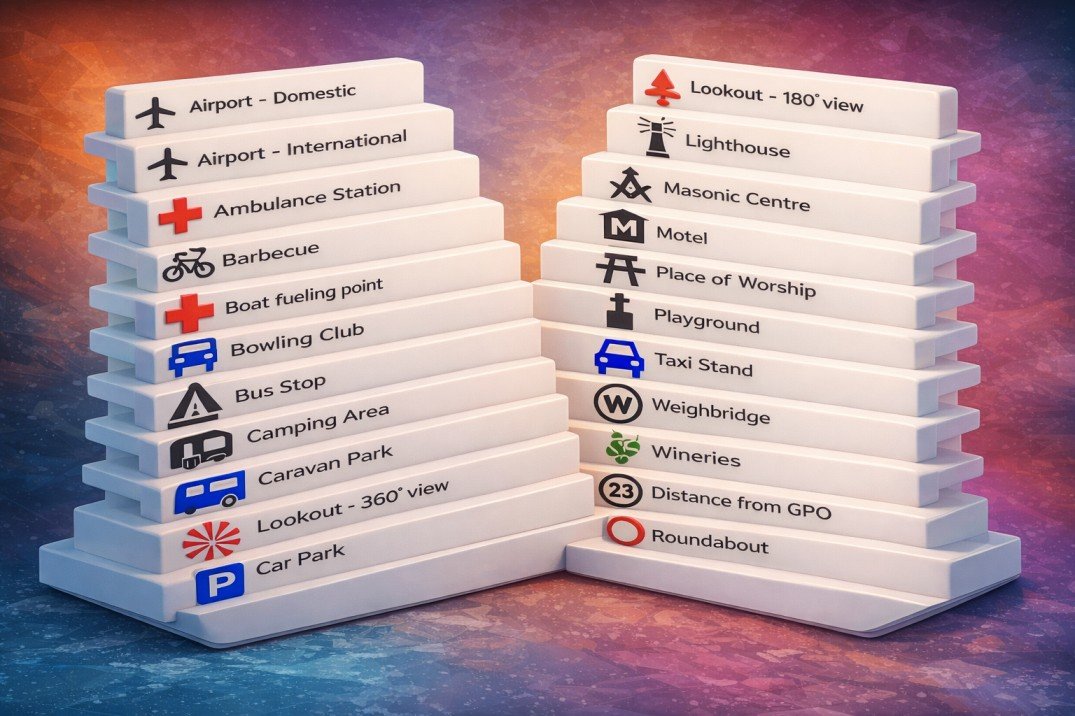
- Maps are usually drawn to show different things on a small or a large scale. The details that are to be shown on it may vary according to requirement. Therefore, it is essential to regard scale and contents while classifying maps. Suppose a tourist wants to visit a place.
- What type of map should he look for? Of course, it is a tourist map. A tourist map contains all the information needed by a tourist like transportation, communication, hotels, tourist centers, etc. Thus, a map that conveys information according to the user and his requirement is known as a thematic map. They include information on any subject like landforms, countries, population, climate, etc.
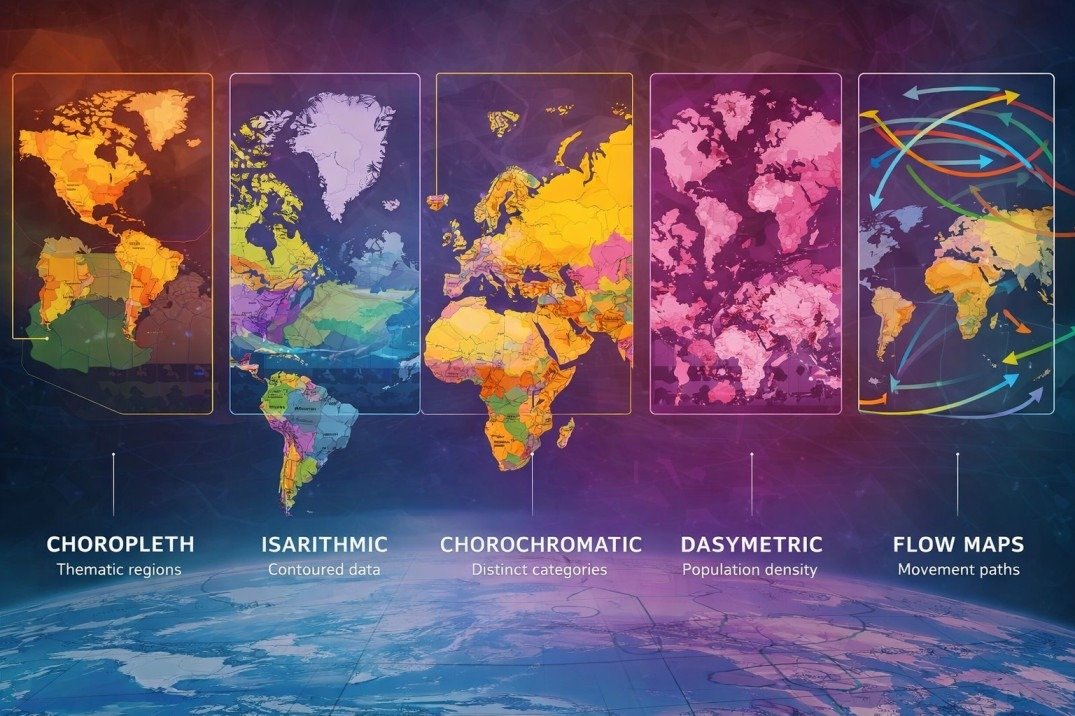
Choropleth Maps
- A choropleth map is a thematic map where geographic regions are colored, shaded, or patterned in relation to a value.This type of map is particularly useful when visualizing a variable and how it changes across defined regions or geopolitical areas.
- For example, a choropleth map is extremely useful when looking at vote totals by political party per county in the United States, as below. In a choropleth map, color can be used to represent distinct attributes or, as in the example below, to represent weight of a value (a strong or weak party vote-share shown as light or dark colors).
- These are maps, where areas are shaded according to a prearranged key, each shading or colour type representing a range of values. Population density information, expressed as ‘per km²,’ is appropriately represented using a choropleth map. Choropleth maps are also appropriate for indicating differences in land use, like the amount of recreational land or type of forest cover.
- A choropleth map (from Greek χῶρος (“area/region”) + πλῆθος (“multitude”)) is a thematic map in which areas are shaded or patterned proportionally to the value of a particular variable measured for each area. Most often the variable is quantitative, with a color associated with an attribute value. Though not as common, it is possible to create a choropleth map with nominal data. Choropleth maps illustrate the value of a variable across the landscape with color that changes across the landscape within a particular geographic area. A choropleth map is an excellent way to visualize how a measurement varies across a geographic area.
- The earliest known choropleth map was created in 1826 by Baron Pierre Charles Dupin.

Designing a Choropleth Map
A choropleth map is constructed from several elements:
- A thematic variable of interest (e.g., median family income, population density, percent Latino).
- A set of districts subdividing the area of interest (e.g., cities, counties, provinces), as a polygon GIS data set.
- A table of values, with a statistical summary of values of the variable in each district, often obtained as a non-spatial table.
- A classification scheme for organizing the range of values of the variable (or a decision to not classify the values).
- A color scheme for mapping each value (or class of values) to a particular color.
- A legend that clearly lists the values associated with each color.
In a well-crafted choropleth map, each of these elements is carefully developed to clearly portray the natural geographic variation in the variable. That is, map readers should be able to intuitively see the real-world patterns without needing to work to decipher the elements themselves.