Correlation
Introduction
- Correlation and Regression analysis are statistical techniques that are broadly used in physical geography to examine causal relationships between variables. Regression and correlation measure the degree of relationship between two or more variables in two different but related ways.
- Correlation, as the name suggests is a word formed by combining ‘co’ and ‘relation’. It refers to the analysis of the relationship that is established between two variables in each dataset. It helps in understanding (or measuring) the linear relationship between two variables.
- Correlation is a statistical method used to determine the extent to which two variables are related. Correlation analysis measures the degree of association between two or more variables.
Definition
- Two variables X and Y are said to be correlated when a change in the value of one variable results in a corresponding change in the value of the other variable. This could be a direct or an indirect change in the value of variables. This indicates a relationship between both the variables.
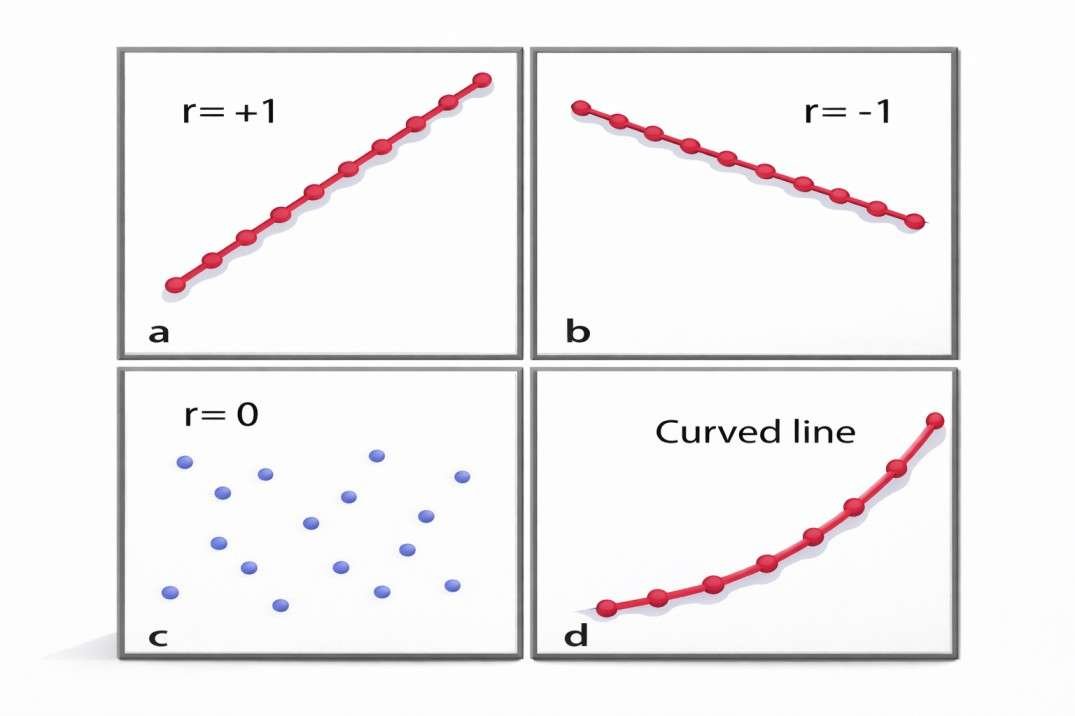
- Correlation is a statistical measure that deals with the strength of the relation between the two variables in question. Correlation can be a positive or negative value.
- Correlation analysis is applied in quantifying the association between two continuous variables, for example, an dependent and independent variable or among two independent variables.
Types of Correlation
Positive Correlation:
A positive correlation is a relationship between two variables where if one variable increases, the other one also increases. A positive correlation also exists in one decrease and the other also decreases.
Examples:
- The more time you spend running on a treadmill, the more calories you will burn.
- As the temperature goes up, ice cream sales also go up.
- The less time I spend marketing my business, the fewer new customers I will have.
Negative Correlation:
- A negative correlation means that there is an inverse relationship between two variables – when one variable decreases, the other increases. The vice versa is a negative correlation too, in which one variable increase and the other decreases.
Examples:
- A student who has many absences has a decrease in grades.
- If the sun shines more, a house with solar panels requires less use of other electricity.
- Price and demand of a commodity.