Directions: Study the table given below and answer questions 1-5. The table shows the populations of three states over the years 2002-2007.
Population (in lakhs) of three states over the years
| State | 2002 | 2003 | 2004 | 2005 | 2006 | 2007 |
|---|---|---|---|---|---|---|
| A | 4.5 | 4.8 | 5.2 | 5.4 | 5.8 | 6.2 |
| B | 3.2 | 3.6 | 3.4 | 3.8 | 4.1 | 4.4 |
| C | 5.6 | 5.5 | 5.8 | 6.3 | 6.6 | 6.9 |
1. What is the average population of State B for all the years together (in lakhs)?
(a) 3.5
(c) 3.75
(b) 3.6
(d) 3.8
2. What is the percentage increase in population of State A between 2002 and 2003?
(a) 5
(c) 6.67
(b) 5.25
(d) 7.5
3. What was the difference between combined populations of all the three states for the years 2004 and 2005?
(a) 90,000
(b) 1,00,000
(c) 1,10,000
(d) None of the above
4. What was the average population of all the three states in 2006 (in lakhs)?
(a) 5.5
(b) 5.8
(d) 6.3
(c) 6.1
5. What is the ratio between combined populations of all the three states in 2004 and 2005?
(a) 155:144
(b) 144: 155
(c) 144:165
(d) 165: 144
Directions: Study the following table carefully and answer questions 6-10. It consists of data on the num-ber of candidates who appeared from five schools in the board exams from 2004 to 2008.
Schools
| Year | A | B | C | D | E |
|---|---|---|---|---|---|
| 2004 | 650 | 760 | 820 | 800 | 780 |
| 2005 | 700 | 740 | 860 | 780 | 740 |
| 2006 | 800 | 820 | 940 | 750 | 730 |
| 2007 | 750 | 880 | 920 | 840 | 790 |
| 2008 | 850 | 840 | 900 | 860 | 770 |
6. The number of students who appeared from School E in 2004 is approximately what percentage of the total number of students who appeared from all the schools together in that year?
(a) 16%
(b) 18%
(c) 20%
(d) 25%
7. What is the average e number of students who appeared from School B for all the years?
(a) 676
(b) 787
(c) 808
(d) 818
8. The number of students who appeared in 2006 from School A is what per cent of the total number of students who appeared from School A for all the years together?
(a) 25.25
(c) 22.45
(b) 21.33
(d) 23.45
9. What is the ratio between the total number of students who appeared in 2004 and 2005 from Schools C and D, respectively?
(a) 84:79
(b) 79:84
(c) 84:89
(d) 89:84
10. What is the average number of students who appeared from the given schools in 2007?
(a) 825
(b) 836
(c) 845
(d) 863
Directions: Study the following table carefully and answer questions 11-15. It consists of data on the graduates and postgraduates living in various towns.
| Towns | Graduates | Postgraduates |
|---|---|---|
| A | 10,200 | 8,000 |
| B | 25,250 | 18,000 |
| C | 15,150 | 10,500 |
| D | 20,200 | 16,250 |
| E | 24,000 | 20,000 |
| F | 16,500 | 18,450 |
11. What is the difference between the number of graduates and the number of postgraduates in town C?
(a) 4500
(b) 4600
(c) 4650
(d) 4560
12. What is the average number of postgraduates in all the towns together?
(a) 15,000
(c) 16,250
(b) 15,500
(d) 15,200
13. What is the ratio of the number of graduates from towns A and B together to the number of postgraduates from towns A and E together?
(a) 709:580
(b) 709:560
(c) 560:709
(d) None of these
14. What is the total number of graduates and postgraduates in towns A, D and F together?
(a) 85,500
(b) 88,600
(c) 89,600
(d) 90,600
15. The number of graduates in town F is approximately what percentage of the number of postgraduates in the same town?
(a) 84
(b) 89
(c) 92
(d) 95
Directions: Study the following bar graph carefully and answer questions 16-20. It consists of data on exports and imports of IT and electronics industry over a period.
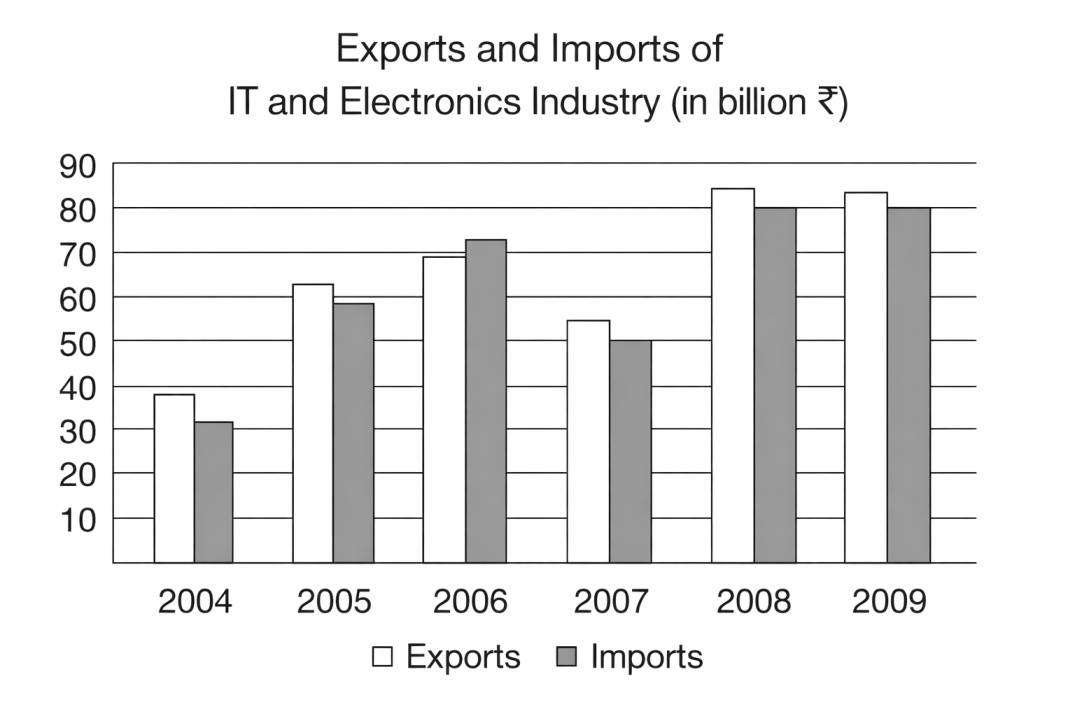
16. For how many years, the exports are at least 10% higher than the imports?
(a) 1
(c) 3
(b) 2
(d) 4