
- Data: Nature, Characteristics and Types
- Characteristics of Data
- Importance of Data in Educational Research
- Data in Quantitative and Qualitative Research
- Types of Data
- Data Distribution: Definition and Types
- Importance of Studying Data Distribution
- Types of Data Distribution
- 1. Normal Distribution
- 2. Skewed Distribution
- 3. Kurtosis (Peakedness and Tail Characteristics of a Distribution)
- 4. Bimodal Distribution
- Graphical Representation of Data Distributions
- Parameter and Statistic
- Definition of Parameter
- Definition of Statistic
- Mathematical Formulas
- Relationship between Parameter and Statistic
- Measurement Scale
- Nominal Scale
- Ordinal Scale
- Interval Scale
- Ratio Scale
- Hierarchical Relationship among Measurement Scales
- Important Mathematical Facts
- Parametric and Non-Parametric Statistics
- Parametric Statistics
- Non-Parametric Statistics
- Basis for Choosing Parametric and Non-Parametric Tests
- Important Formulas
- Quantitative Data Analysis
- Steps in Quantitative Data Analysis
- Types of Quantitative Data Analysis
- Tools and Software Used in Quantitative Data Analysis
- Basic Concepts in Quantitative Data Analysis
- Advantages of Quantitative Data Analysis
- Limitations of Quantitative Data Analysis
- Descriptive Data Analysis
- Components of Descriptive Data Analysis
- Measures of Central Tendency
- Measures of Variability (Dispersion)
- Measures of Position
- Graphical Presentation of Data
- Confidence Intervals
- Steps in Conducting Descriptive Data Analysis
- Advantages of Descriptive Data Analysis
- Limitations of Descriptive Data Analysis
- Inferential Data Analysis
- Purpose of Inferential Data Analysis
- Types of Inferential Data Analysis
- Steps in Conducting Inferential Data Analysis
- Assumptions for Using Inferential Techniques
- Importance of Inferential Data Analysis in Educational Research
- Use and Interpretation of Statistical Techniques
- Purpose of Using Statistical Techniques
- Classification of Statistical Techniques
- Commonly Used Statistical Techniques and Their Interpretation
- Interpretation Guidelines for Statistical Results
- Conditions for Using Statistical Techniques
- Use of Statistical Techniques in Educational Research
- Cautions in the Use and Interpretation of Statistical Techniques
- Testing of Hypothesis (Type I and Type II Errors)
- Key Concepts of Hypothesis Testing
- Steps in Hypothesis Testing
- Decision Rules in Hypothesis Testing
- Errors in Hypothesis Testing
- Levels of Significance
- Commonly Used Levels of Significance
- Decision Rule for the Level of Significance
- Factors Influencing the Choice of Significance Level
- Meaning of the (p)-Value
- Meaning of the Level of Significance (\(alpha\))
- Common Statistical Tests Used to Calculate (p)-Values
- Interpretation Guidelines
- Power of a Statistical Test and Effect Size
- Power
- Effect Size
- Relationship Between Statistical Power and Effect Size
- Qualitative Data Analysis (Definition, Types, Techniques and Tools)
- Characteristics of Qualitative Data Analysis
- Types of Qualitative Data
- Types of Qualitative Data Analysis
- Steps in Qualitative Data Analysis
- Techniques of Qualitative Data Analysis
- Common Tools and Software for Qualitative Data Analysis
- Ensuring Trustworthiness in Qualitative Analysis
- Concept of Triangulation (Meaning, Definition and Importance)
- Types of Triangulation (Denzin)
- Purpose of Triangulation
- Importance of Triangulation in Research
- Advantages of Triangulation
- Limitations of Triangulation
- Triangulation and Mixed-Methods Research
Data: Nature, Characteristics and Types
The term data is derived from the Latin word datum, meaning “something given.” In educational research, data refers to the facts, figures, observations, measurements, responses or other information collected systematically to investigate a research problem, test a hypothesis, identify relationships and draw meaningful conclusions.
Data are the raw materials of research. They may not have a clear meaning when considered in isolation, but when they are organised, processed and analysed, they help researchers develop information and knowledge. For example, the marks obtained by students in an achievement test constitute data. When these marks are analysed to calculate the class average, compare student performance or identify learning difficulties, they provide meaningful information for educational decision-making.
According to Kerlinger (1986), data can be understood as the scores or measurements obtained from subjects on one or more variables. A variable is a characteristic that can take different values, such as age, intelligence, academic achievement, motivation or teaching effectiveness. Data collected about these variables enable researchers to examine patterns, differences and relationships.
Examples of educational research data include students’ achievement test scores, responses to questionnaires, interview transcripts, classroom observation records, attendance percentages, teacher reflections and school enrolment statistics.
Characteristics of Data
- Systematic collection: Data should be collected according to a planned procedure using appropriate research methods and tools. Systematic collection reduces errors and improves the consistency of research findings.
- Relevance: Data must be directly related to the objectives and research questions of the study. Irrelevant data consume time and resources without contributing meaningfully to the investigation.
- Quantitative or qualitative nature: Data may be numerical, such as examination marks and attendance percentages, or descriptive, such as students’ opinions, teachers’ experiences and classroom interactions.
- Accuracy: Data should represent the actual observations, responses or measurements as correctly as possible. Errors in recording, measurement or data entry can affect the findings.
- Validity: Data should appropriately represent the characteristic or phenomenon that the researcher intends to study. For example, a test designed to measure mathematical ability should assess relevant mathematical skills.
- Reliability and consistency: Data collected through a reliable instrument or procedure should produce reasonably consistent results under comparable conditions. Reliability is particularly important when using achievement tests, rating scales and questionnaires.
- Verifiability: Data should be recorded and documented in a manner that allows checking, examination and verification by the researcher or other authorised investigators.
- Objectivity: Data collection and interpretation should minimise personal bias. Clearly defined procedures and standardised instruments help researchers maintain objectivity.
- Analysability: Data should be organised in a suitable form for interpretation. Numerical data can be analysed statistically, whereas descriptive data may be examined through coding, categorisation and thematic analysis.
- Empirical basis: Research data are generally grounded in observation, experience, measurement, documents or recorded responses rather than unsupported assumptions.
Importance of Data in Educational Research
Data play a central role in scientific investigation because research findings depend on the quality and relevance of the information collected.
Basis of analysis and interpretation: Data enable researchers to examine educational problems systematically and identify meaningful patterns.
Testing hypotheses: Empirical data help researchers determine whether the evidence supports or contradicts a proposed hypothesis.
Comparison: Data allow comparisons between students, schools, teaching methods, educational programmes and assessment techniques.
Prediction: Statistical relationships and historical patterns in data can help researchers estimate future outcomes, such as student achievement or school enrolment.
Generalisation: Properly collected data from an appropriate sample may support conclusions about a larger population, subject to the sampling method and limitations of the study.
Policy formulation: Data on enrolment, attendance, dropout rates, learning outcomes and teacher availability help educational authorities formulate and evaluate policies.
Decision-making: Teachers and administrators use data to identify learning gaps, allocate resources and improve teaching strategies.
Scientific objectivity: Evidence-based investigation reduces dependence on personal opinions and unsupported beliefs.
Evaluation of programmes: Data help assess the effectiveness of educational interventions, curriculum changes, teacher training and student-support programmes.
Data in Quantitative and Qualitative Research
Data are broadly classified as quantitative and qualitative according to their nature and the type of information they provide.
Aspect | Quantitative Data | Qualitative Data |
|---|---|---|
Nature | Numerical and measurable | Descriptive and interpretive |
Main purpose | To measure variables, compare groups and identify statistical relationships | To understand experiences, meanings, opinions and social contexts |
Collection tools | Achievement tests, structured questionnaires, rating scales and standardised assessments | Interviews, observations, focus groups, documents and open-ended questions |
Form of data | Numbers, scores, frequencies and percentages | Words, narratives, descriptions, images and recorded interactions |
Analysis | Statistical methods such as mean, median, correlation, standard deviation and t-test | Thematic analysis, content analysis, coding and interpretation |
Typical outcome | Estimates, comparisons and statistical relationships | Detailed contextual understanding and identification of themes |
Example | Examination marks of 200 students | Interviews describing students’ experiences of classroom learning |
Quantitative research is particularly useful when the researcher wants to measure variables, compare groups or test hypotheses statistically. Qualitative research is useful when the objective is to understand why people behave in a particular way, how they experience an educational situation or what meanings they attach to an event. The two approaches can also be combined in mixed-methods research, in which numerical evidence and descriptive information are used together to investigate a problem more comprehensively.
Types of Data
Data can be classified on several bases, including their source of collection, nature, measurement scale, continuity and mode of collection or time dimension. These classifications serve different purposes, and a single dataset may belong to several categories simultaneously.
1. Based on the Source of Collection:
Data are classified as primary or secondary according to whether the researcher collects them directly for the present investigation or obtains them from existing sources.
Type | Description | Examples |
|---|---|---|
Primary Data | Data collected first-hand by the researcher for a specific research purpose. | Questionnaire responses, interviews, classroom observations, achievement tests and experimental measurements. |
Secondary Data | Data obtained from existing records or sources that were originally collected or compiled for another purpose. | Census reports, government publications, research journals, school records, published statistics and educational databases. |
Primary data provide direct information related to the research problem and allow the researcher greater control over the collection procedure. However, collecting them may require considerable time, money and effort.
Secondary data are often economical and readily available. Their usefulness depends on their accuracy, relevance, date of collection, original purpose and suitability for the present study. For example, a researcher investigating school dropout rates may collect primary data through interviews with students or use secondary data from government education reports.
2. Based on the Nature or Form of Data:
According to their form, data are classified into quantitative and qualitative data.
Type | Description | Examples |
|---|---|---|
Quantitative Data | Data expressed numerically and capable of measurement or numerical analysis. | Students’ marks, age, attendance percentage, number of books and test scores. |
Qualitative Data | Data expressed through descriptions, categories, experiences, opinions or meanings. | Interview transcripts, classroom observations, teacher reflections and students’ narratives. |
Quantitative data can be further classified into discrete and continuous data. Qualitative data may include nominal categories, such as subject stream, as well as descriptive information collected through interviews and observations. The distinction between qualitative and quantitative data depends on the form and analytical purpose of the information.
3. Based on the Measurement Scale:
The classification of measurement scales was developed by S. S. Stevens (1946). He identified four major scales: nominal, ordinal, interval and ratio. These scales differ in the mathematical properties of the information they represent and determine which statistical operations are appropriate.
Scale | Description | Examples |
|---|---|---|
Nominal Scale | Classifies observations into distinct categories without any inherent order. | Subject stream, blood group and categories of school management. |
Ordinal Scale | Arranges observations in a meaningful order, but the differences between successive positions are not necessarily equal. | Class ranks, satisfaction ratings and levels of educational achievement. |
Interval Scale | Has ordered values with equal intervals between them but lacks a true, non-arbitrary zero. | Temperature measured in Celsius or Fahrenheit; certain standardised scores when treated as interval-level measures. |
Ratio Scale | Has ordered values, equal intervals and a true zero representing the absence of the measured quantity. | Age, weight, height, time taken and number of students. |
- The nominal scale is the simplest measurement scale because it identifies categories without ranking them. The ordinal scale adds ranking, but the difference between two ranks cannot automatically be treated as equal to the difference between two other ranks.
- The interval scale permits meaningful comparisons of differences. For example, the difference between 20°C and 30°C is equal to the difference between 30°C and 40°C, but 40°C is not twice as hot as 20°C in the ratio-scale sense.
- The ratio scale permits comparisons involving both differences and ratios because it possesses a true zero. For example, a class with 40 students has twice as many students as a class with 20 students.
- Important distinction: Examination marks are often treated as numerical or interval-like data in educational analysis, but their precise measurement properties depend on the assessment design. A score of zero does not necessarily mean the complete absence of the underlying ability.
4. Based on Continuity:
According to the possible values they can take, numerical data are classified as discrete and continuous.
Type | Description | Examples |
|---|---|---|
Discrete Data | Data that take distinct, countable values, generally whole numbers when counting objects or events. | Number of students in a classroom, number of books borrowed and number of absences. |
Continuous Data | Data that can take any value within a specified range, depending on the precision of measurement. | Height, weight, time taken to complete a test and measured reaction time. |
- Discrete data arise mainly from counting, whereas continuous data arise mainly from measurement. For example, the number of students in a class may be 40 or 41, but it cannot ordinarily be 40.5. A student's height, however, may be recorded as 160 cm, 160.5 cm or 160.55 cm, depending on the measuring instrument.
- Achievement scores require careful classification. The number of marks awarded in a test may be discrete when only whole marks are permitted. A calculated or standardised achievement score may contain decimal values, but the presence of decimals alone does not make a variable genuinely continuous.
5. Based on the Mode of Collection and Time Dimension:
Data can also be classified according to when they are collected and whether observations are repeated over time. Cross-sectional and longitudinal data describe the temporal design of a study, whereas time-series data are organised as observations recorded at successive time points.
Type | Description | Examples |
|---|---|---|
Cross-sectional Data | Data collected from individuals, groups or units at a particular point in time or during a relatively short period. | A survey of teachers’ attitudes towards online learning in 2025. |
Longitudinal Data | Data collected repeatedly over an extended period to examine changes, development or continuity. | Tracking students’ academic performance from Grade 1 to Grade 5. |
Time-Series Data | Observations of a variable recorded at successive time points, often at regular intervals, to identify trends and patterns. | Annual school enrolment figures over ten years or monthly attendance rates over five years. |
- Cross-sectional research is useful for examining the existing characteristics of a population and comparing different groups at a particular time. For example, a researcher may compare the digital learning skills of teachers from rural and urban schools in the same year.
- Longitudinal research examines change over time and may use repeated observations of the same individuals, schools or groups. It is useful for studying student development, the long-term effects of educational interventions and changes in learning outcomes. However, longitudinal studies may face difficulties such as participant dropout, changing measurement procedures and higher costs.
- Time-series data are particularly useful for identifying long-term trends, seasonal variations and changes following a policy intervention. For example, annual enrolment figures can reveal whether participation in school education is increasing or decreasing over a decade. Unlike a simple cross-sectional dataset, a time series explicitly preserves the chronological order of observations.
- A distinction is important: longitudinal data commonly follow the same subjects or units over time, whereas time-series data focus on the successive values of a variable. Longitudinal data may be analysed as time series when the observations have an appropriate temporal structure.
Data Distribution: Definition and Types
- Data distribution refers to the pattern or arrangement of data values in a dataset, indicating how frequently individual values or groups of values occur. It describes how observations are spread, concentrated or distributed across a range of values. The study of data distribution helps researchers understand the central tendency, variability, symmetry and shape of data, which are essential for selecting appropriate statistical techniques and interpreting research findings.
- In educational research, data distribution helps explain how students perform in tests, how intelligence scores vary within a population, and how achievement levels differ among groups. For example, if the marks of 100 students are recorded, the distribution shows whether most students obtained average marks, whether scores were concentrated at the higher or lower end, or whether two distinct groups of scores appeared.
- A distribution can be presented through frequency tables, histograms, frequency polygons, ogives, bar graphs, pie charts and box plots. The selection of a particular representation depends on the nature of the data and the purpose of the analysis.
- Garrett (1981) described a distribution as a summary of the frequency of individual values or groups of values in a dataset. In statistical analysis, a frequency distribution organises observations into categories or class intervals and records the number of observations falling within each category.
Importance of Studying Data Distribution
Understanding data characteristics: It reveals the centre, spread and shape of a dataset, helping researchers understand the general pattern of observations.
Identifying skewness and outliers: It helps detect unusually high or low values and determine whether data are symmetrically or asymmetrically distributed.
Selecting statistical tests: The distribution of data helps researchers decide whether parametric or non-parametric statistical methods are appropriate.
Comparing groups: It facilitates the comparison of achievement, intelligence, aptitude and other measured characteristics across different groups.
Calculating probabilities: Theoretical distributions, such as the normal, t and F distributions, provide the basis for many probability calculations and statistical tests.
Drawing inferences: Knowledge of sample distributions helps researchers estimate population characteristics and assess the statistical significance of research findings.
Evaluating measurement quality: Distribution patterns can reveal whether a test is too easy, too difficult or insufficiently effective in distinguishing among individuals.
Types of Data Distribution
Data distributions can be classified according to their shape, symmetry, number of peaks and other statistical characteristics. Important types include normal distribution, skewed distribution, kurtosis-based distributions and bimodal distribution.
1. Normal Distribution
A normal distribution is a continuous probability distribution characterised by a symmetrical, bell-shaped curve in which most observations cluster around the mean and frequencies decrease progressively towards both extremes.
It is one of the most important distributions in statistics because many statistical procedures are based on its mathematical properties. In educational research, normal distributions are often used to study test scores, intelligence measurements, aptitude scores and other continuous variables. Actual data do not always follow a perfectly normal distribution.
Key features and characteristics:
Mean, median and mode are equal: All three measures of central tendency coincide at the centre of the distribution.
Perfect symmetry: The left and right sides of the curve are mirror images of each other.
Bell-shaped curve: The distribution has a single central peak and gradually decreases towards both extremes.
Unimodal nature: It has only one mode, or one principal peak.
Infinite tails: The tails extend indefinitely in both directions and approach, but never touch, the horizontal axis.
Total area equals 1: The entire area under the probability curve represents a probability of 1, or 100%.
Determined by two parameters: The mean, represented by (mu), determines the centre, while the standard deviation, represented by (sigma), determines the spread.
Empirical Rule (68–95–99.7 Rule)
The empirical rule describes the approximate proportion of observations lying within one, two and three standard deviations of the mean in a normal distribution.
Range around the mean | Percentage of observations |
|---|---|
Within one standard deviation | 68.27% |
Within two standard deviations | 95.45% |
Within three standard deviations | 99.73% |
These ranges can be expressed as:
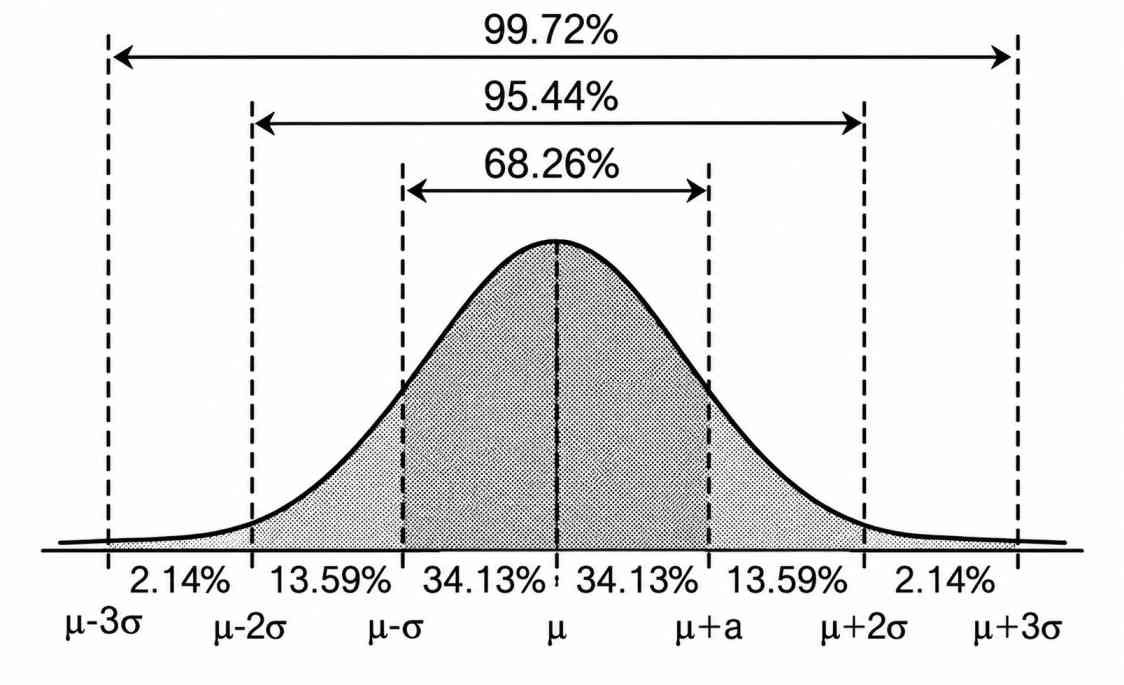
Normal Distribution Curve
Within one standard deviation: \(\mu \pm 1\sigma\)
Within two standard deviations: \(\mu \pm 2\sigma\)
Within three standard deviations: \(\mu \pm 3\sigma\)
For example, if students' test scores follow a normal distribution with a mean of 60 and a standard deviation of 10:
Approximately 68.27% of students score between 50 and 70.
Approximately 95.45% score between 40 and 80.
Approximately 99.73% score between 30 and 90.
The normal distribution is widely used in inferential statistics and provides the theoretical basis for many procedures, including z-tests and certain applications of t-tests, ANOVA and Pearson correlation. However, these methods do not all require the raw data to be normally distributed in every situation. Their assumptions depend on the particular test, sampling design and model. For example, many tests concerning means assume normality of the errors or residuals rather than necessarily requiring the entire dataset to be normally distributed.