
Introduction
The economic theories suggested by economist John Maynard Keynes in the 1930s can be described and explained through the IS-LM model. In 1936 when Keynes published their magnum opus, “The General Theory of Employment, Interest, and Money”, economist John Hicks constructed the IS-LM model in 1937. IS-LM Model is a macroeconomic tool that shows the interaction between interest rates and production within the money market. This model highlights the main ideas of Keynesian economic theory and its full form is Investment-Savings and Liquidity Preference-Money Supply. In addition, it represents the equilibrium that emerges between real production and interest rates.
The IS-LM model is derived from “Investment Savings” (IS) and “Liquidity Preference-Money Supply” (LM).
The model explains the impact of changes in market preferences on the levels of market interest rates and GDP that are in equilibrium.
The IS-LM model is also known as the Hicks-Hansen Model.
It offers insights into the complicated aspects of the economy.
Components of IS-LM Model
The IS-LM model includes components such as monetary and fiscal policy, liquidity preference, and the balance between investment and saving:
- Monetary Policy: This involves the central bank’s management of the money supply and interest rates to achieve macroeconomic goals. It plays a pivotal role in influencing economic stability and controlling inflation.
- Fiscal Policy: This encompasses government decisions on spending and taxation, directly impacting aggregate demand. It serves as a potent tool for policymakers to navigate economic conditions and stimulate growth.
- Liquidity Preference: Reflects individuals’ inclination to hold cash rather than invest it. This psychological aspect influences economic decisions and plays a role in shaping monetary policy.
- Investment-Saving Balance: This represents the intricate relationship between savings and investment, a critical factor in understanding the impact of economic policies on investment decisions and overall economic growth.
IS Curve and LM Curve
The IS-LM Model comprises the IS Curve and LM Curve:
IS Curve
The IS Curve outlines the correlation between real interest rates and output levels. It shows the impact of investment and government spending changes on AD (Aggregate Demand) and Economic Equilibrium. The shift in the IS curve directly impacts the equilibrium output level which can provide valuable insights to policymakers in fiscal policy changes.
Figure 1 shows the IS curve graphically. The goods market is shown on the left side and the IS curve is shown on the right side. The real GDP is shown on the X-axis and the real interest rate is shown on the Y-axis. This curve shows the equilibrium in the goods market at different real interest rate levels. A particular level of economic output is associated with each equilibrium. The real interest rate is in equilibrium when the saving and investment curves are the same.
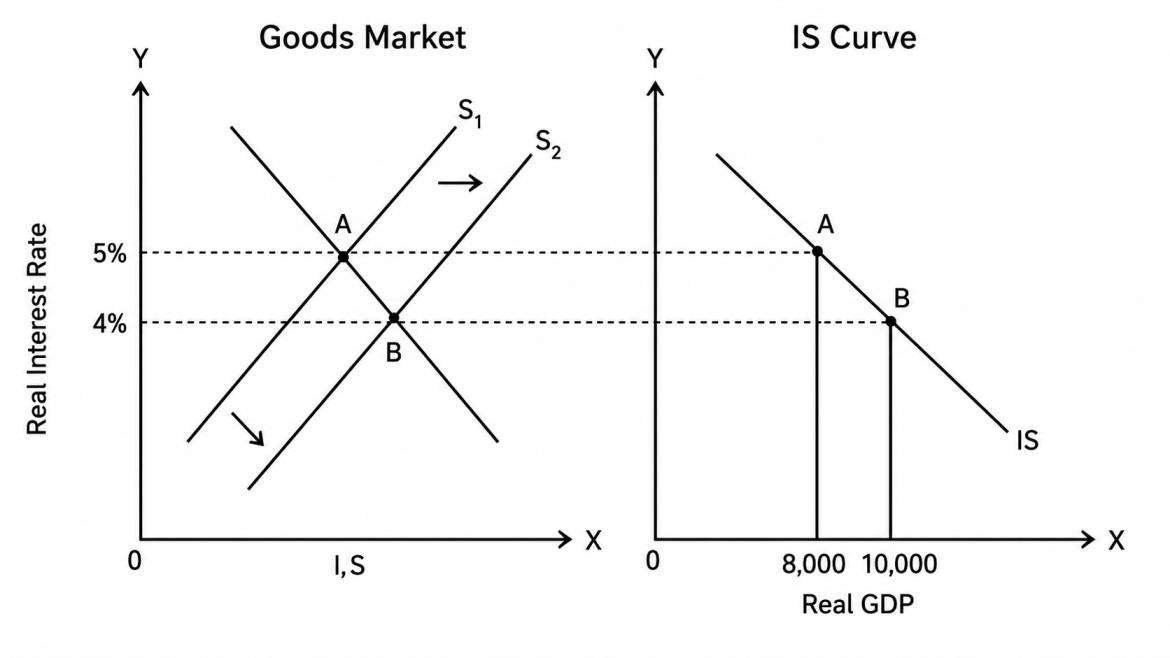
This can be better understood with an example. Suppose the real interest rate is 5%, and the output in the economy is 8000 units. Now, the output increases from 8,000 units to 10,000 units in an economy. The increased output increases the savings resulting in a shift from S1 to S2. This increase in savings leads to a decrease in the real interest rates. The new equilibrium shifts from point A to B, with higher output and lower interest rates. Due to this negative relationship between output and real interest rate, the IS curve is downward sloping.