Introduction
Network analysis is an important aspect of transport geography because it involves the description of the disposition of nodes and their relationships and line or linkage of distribution. It gives measures of accessibility and connectivity and also allows comparisons to be made between regional networks within a country and between other countries.
As Fitzgerald (1974) has said, variations in the characteristics of networks may be considered to reflect certain spatial aspects of the socio-economic system.
“The connectivity of a network may be defined as the degree of completeness of the links between nodes” (Robinson and Bamford, 1978). When a network is abstracted as a set of edges that are related to set of vertices (nodes), a fundamental question is the degree to which all pairs of vertices are interconnected.
“The degree of connection between all vertices is defined as the connectivity of the networks” (Taaffe and Gauthier, 1973). The greater the degree of connectivity within a transportation network, the more efficient with that system be. Kansky (1963) has studied the structure of transportation networks, developed several descriptive indices for measuring the connectivity of networks, i.e., beta, gamma, alpha indices and cyclomatic number.
Measures at the Network Level
Transportation networks are composed of many nodes and links, and as they rise in complexity, their comparison becomes challenging. For instance, it may not be at first glance evident to assess which of two transportation networks is the most accessible or the most efficient. Several measures and indices can be used to analyze network efficiency, with many initially developed by Kansky in the 1960s:
- Expressing the relationship between values and the network structures they represent.
- Comparing different transportation networks at a specific point in time.
- Comparing the evolution of a transport network at different points in time. Outside the description of the network size by the number of nodes and edges, and its total length and traffic, several measures are used to define the structural attributes of a graph; the diameter, the number of cycles and the order of a node.
Diameter (d)
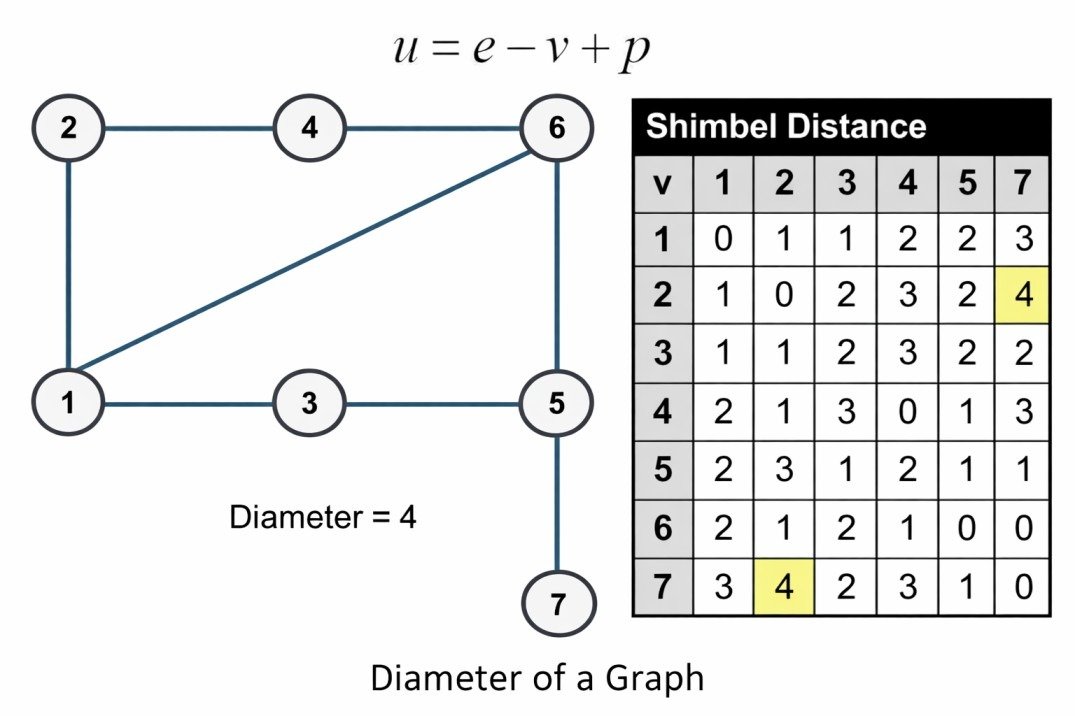
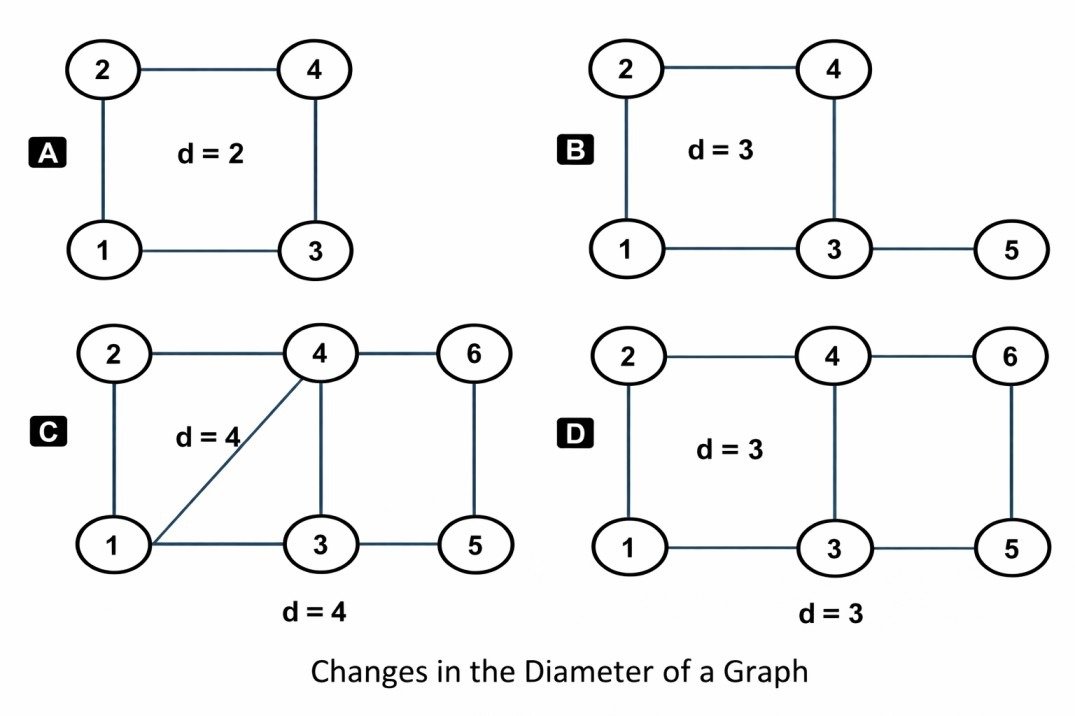
The length of the shortest path between the most distanced nodes of a graph. It measures the extent of a graph and the topological length between two nodes.
The diameter enables us to measure the development of a network in time. A high diameter implies a less linked network. In the case of a complex graph, the diameter can be found with a topological distance matrix (Shimbel distance), which computes for each node pair its minimal topological distance. Graphs which extent remains constant, but with higher connectivity, have lower diameter values. Planar networks often have a large diameter due to the presence of many intermediate stops between two distant nodes.
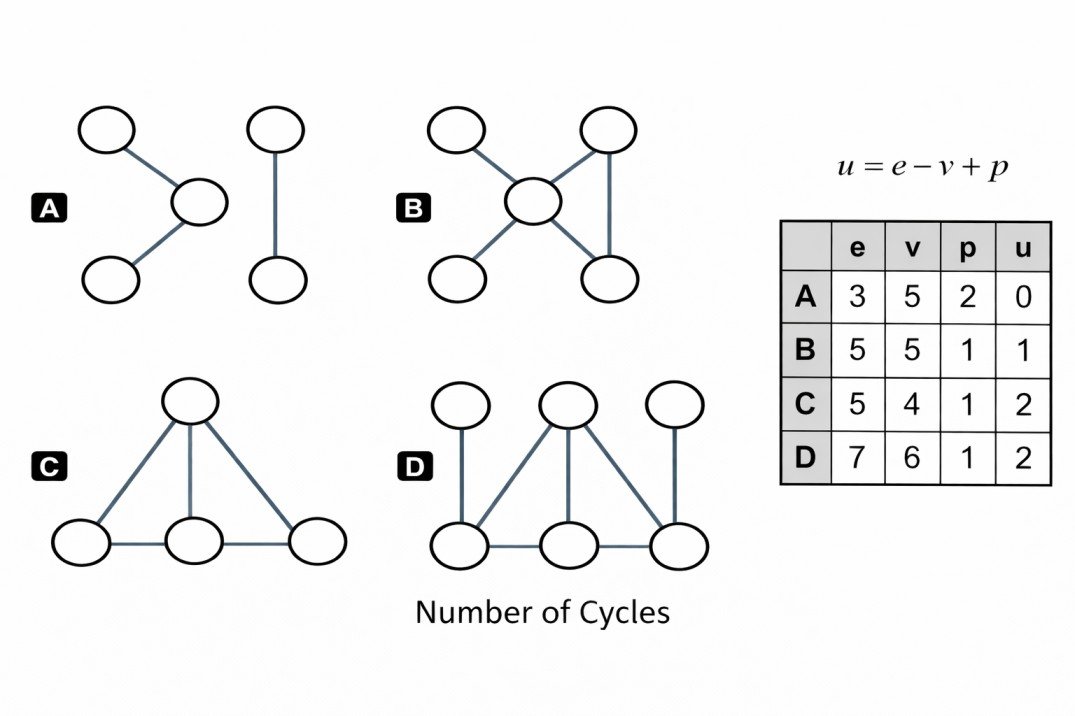
Number of Cycles (u)
The maximum number of independent cycles in a graph. This number (u) is estimated through the number of nodes (v), links (e) and of sub-graphs (p). Trees and simple networks have a value of 0 since they have no cycles. The more complex a network is, the higher the value of u, so it can be used as an indicator of the level of development and complexity of a transport system.