
Introduction
- While making any data analysis from the observations given on a variable, we, very often, observe that the degree or extent of variation of the observations individually from their central value (mean, median or mode) is not the same and hence becomes much relevant and important from the statistical point of view.
- The necessity is keenly felt in different fields like economic and business analysis and forecasting, while dealing with daily weather conditions, etc. specially in making predictions for future purposes.
- The statisticians here prescribe for an well-known concept “dispersion” or the scatteredness or variability of the values of the variable usually from their arithmetic mean. More precisely, it measures the degree of variability in the given observation on a variable from their central value (usually the mean or the median).
- While going in detail into the study of it, we find a number of opinions and definitions given by different renowned personalities like Prof. A. L. Bowley, Prof. L. R. Cannon, Prog. Spiegel, etc. as their own. In this context, we think the definition given by Prof. Yule and Kendall is well accepted, complete and comprehensive in nature as it includes all the important characteristics for an ideal measure of dispersion.
- According to them, it should be based on all the given observations, should be readily comprehensible, fairly and easily calculable, be affected as little as possible by sampling fluctuations and amenable to further algebraic treatments.
The following are thus unhesitatingly considered as important characteristics for an ideal measure of dispersion:
- It should be rigidly defined,
- It should be easy to calculate and easily understandable,
- It should be calculated considering all the available observations,
- It should be amenable to further mathematical treatments,
- It should be least affected from sampling fluctuations.
Measures of Dispersion
The usual measures of dispersion, very often suggested by the statisticians, are exhibited with the aid of the following chart:
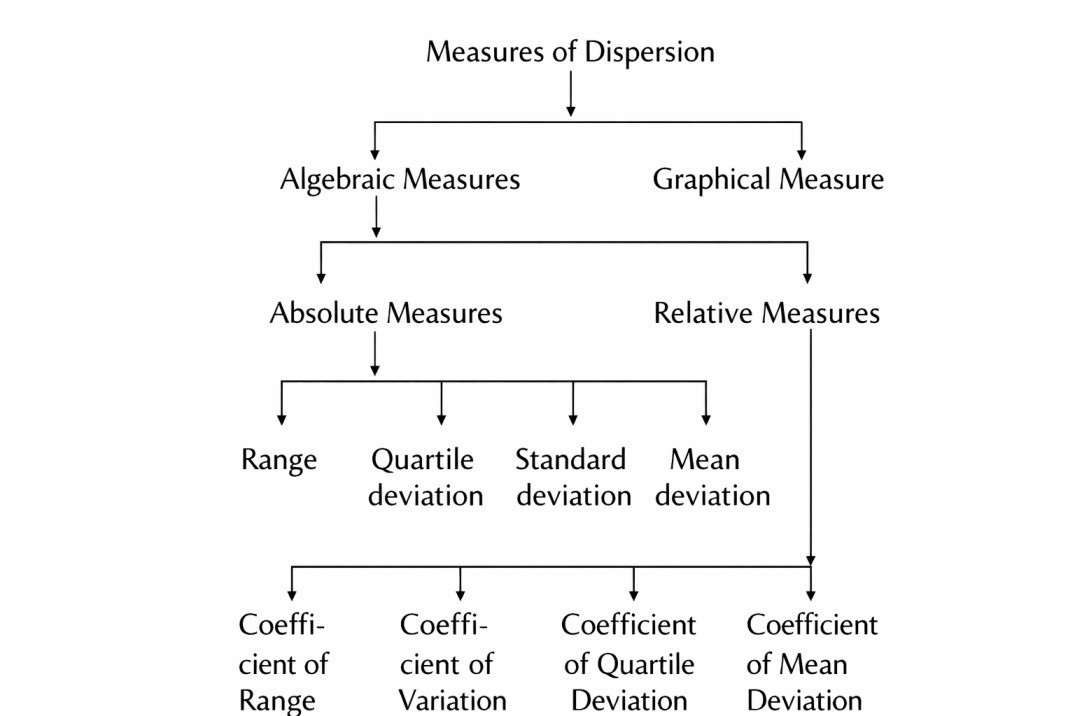
- Primarily, we use two separate devices for measuring dispersion of a variable. One is a Algebraic method and the other is Graphical method. In the algebraic method we use different notations and definitions to measure it in a number of ways and in the graphical method we try to measure the variability of the given observations graphically mainly drought scattered diagrams and by fitting different lines through those scattered points.
- In the Algebraic method we split them up into two main categories, one is Absolute measure and the other is Relative measure. Under the Absolute measure we again have four separate measures, namely Range, Quartile Deviation, Standard Deviation and the Mean Deviation. And finally, under the Relative measure, we have four other measures termed as Coefficient of Range, Coefficient of Variation, Coefficient of Quartile Deviation and the Coefficient of Mean Deviation.