
Temperature is one of the most widespread and significant physical variables in an organism’s surroundings. It is a measurement of the average rate of atom and molecule random motions: the greater the temperature, the faster the motion. In this article, we will mainly discuss atmospheric temperature. The sun is the primary indirect source of atmospheric temperature. (Atmosphere receives the majority of its energy from long-wave terrestrial radiation). On average, the heating and cooling of the atmosphere is accomplished through direct solar radiation and the transfer of energy from the earth via conduction, convection, and radiation.
Temperature As An Element of Weather and Climate
- Temperature is the degree of hotness or coolness of the atmosphere on a scale of one to ten.
- Temperature varies throughout the day due to the Earth’s rotation and during the annual seasons due to the Earth’s translational motion around the sun.
- It’s usually expressed in degrees Celsius or Fahrenheit.
- A thermometer is a device that is used to measure temperature.
- As temperature influences other aspects of the weather, it is a critical factor in determining the weather.
- The energy radiated in the form of light from the Sun to the Earth is known as heat.
- About half of the solar energy is reflected back into space by clouds, water vapor, and air dust, while the rest is absorbed by soil and water and converted to heat.
- Temperature varies throughout the day due to the Earth’s rotation and during the annual seasons due to the Earth’s translational motion around the sun.
- In more practical terms, kinetic energy is created when particles in the air move or vibrate at a given speed.
- In other terms, temperature can also be defined as the measure of the amount of kinetic energy in the air that manifests physically as heat or cold.
- The temperature rises as the particles begin to move/rotate faster.
- The temperature begins to drop as the particles begin to slow down.
- Thus temperature has a significant impact on weather and climate and also on other primary elements.
Distribution of Temperature
Heat is produced when insolation interacts with the atmosphere and the earth’s surface, and it is quantified in terms of temperature. Temperature dispersion varies both Horizontally and Vertically. This article will explain to you about Distribution of Temperature which will be helpful in Geography preparation for the UPSC Civil service exam.
Temperature distribution varies both horizontally and vertically. Let us study it further:
- Horizontal Distribution of Temperature
- Vertical Distribution of Temperature
Heat and Temperature
|
Horizontal Distribution of Temperature
- The horizontal distribution refers to the temperature dispersion across latitudes on the earth’s surface.
- Horizontal Temperature distribution is depicted by using Isotherms on maps.
What is an isotherm, exactly? The terms ‘iso’ and ‘therm’ make up an isotherm. “Iso” stands for “equal,” while “therm” stands for “temperature.” Isotherms are temperature equal line linking locations. |
- The horizontal distribution of temperature appears uneven while viewing at an isotherm map.
- Net solar insolation is highest over lower latitudes and lower in higher latitudes.
- Thus, the equatorial region is hot in general, and the temperature remains high throughout the year.
- The temperature generally decreases from the equator to the poles.
- At and around the poles, the temperatures are the lowest.
- Because the seasonal extremes of high and low temperature are most visible in both the northern and southern hemispheres during these months, the horizontal distribution of temperature around the globe may be easily analysed from maps of the months of January and July.

Latitudinal Variation in a Net Radiation Balance
Factors Affecting the Horizontal Distribution of Temperature
Latitude:
- The angle of incidence of the sun’s rays decreases from the equator to the poles.
- The temperature rises as the angle of incidence rises. In the same way, the lower the angle of incidence, the lower the temperature.
- As a result, temperatures are greater towards the tropics and lower towards the poles.
Altitude:
- As we ascend in altitude, the temperature in the troposphere decreases.
- The Normal Lapse Pace is defined as the rate at which temperature drops by about 6 degrees Celsius every 1000 meters altitude.
Land and Sea Contrast:
- In comparison to land, the water heats up and cools down slowly. Land swiftly heats up and cools down.
- As a result, the temperature on land is greater during the day while the temperature in the ocean is higher at night.
- The sea and land breezes also have a cooling effect on sites near the water, which helps to keep the temperature down.
- Seasonal changes in land and sea temperatures also exist. During the summer, the temperature of the air above land is higher than that of the oceans.
- In the winter, however, the air over the oceans reaches a higher temperature than the landmass.
Ocean Currents:
- There are two sorts of ocean currents: warm and cold.
- Warm currents raise the temperature of the coasts they pass through, while cold currents lower the temperature of the coasts they pass through.
- The North-Western European Coasts do not freeze in the winter due to the effect of North Atlantic Drift (a warm current), whereas the Quebec on Canada’s coast is frozen due to the Cold Labrador Current flowing along it, despite the fact that the Quebec is located at a lower latitude than the North-Western European Coast.
Air Masses:
- The passage of air masses affects the temperature in the same way that land and sea breezes do.
- The temperature is higher in places where warm air masses are present, and it is lower in places where cold air masses are present.
Vegetation Cover:
- Soil that is devoid of plants receives heat more quickly than soil that is covered by vegetation. Because vegetation absorbs a large portion of the sun’s heat and prevents rapid radiation from the earth, whereas the former does so more quickly.
- As a result, temperature changes are fewer in thickly forested areas than in desert ones.
- Winds, the type of the soil, the slope and aspect of the surface, relief features, and other elements, among others, are responsible for the unequal horizontal distribution of temperature.
Temperature Distribution Around the World
- The temperature distribution for January and July can be used to understand the global distribution of temperature.
- Isotherms are commonly used to depict temperature dispersion on a map. Isotherms are lines that connect points of equal temperature.
- The effects of latitude are often well represented on the map, as isotherms are generally parallel to latitudes.
- The departure from the trend is more common in January than in July, particularly in the northern hemisphere.
- The land surface in the northern hemisphere is substantially larger than in the southern hemisphere. As a result, the influence of land masses and ocean currents can be seen clearly.
Horizontal Temperature Distribution in January Month
- The sun shines vertically overhead near the tropic of Capricorn in January. As a result, summer is in the southern hemisphere and winter is in the northern.
- The southern hemisphere’s landmasses, primarily in three regions, have a high temperature. North-western Argentina, East and Central Africa, and Central Australia are the three regions in question.
- They are sealed with a 30°C isotherm.
- In a small area of the Western Australian desert, the maximum mean temperature in January is around 32 °C.
- At both 80° N and 50° N latitudes, the average January temperature along 60° E longitude is negative 20° C.
- January’s average monthly temperature is over 27° C in the tropics, over 24° C in the equatorial oceans, 2° C – 0° C in the intermediate latitudes, and –18° C to –48° C in the Eurasian continental interior.
- Landmasses in the northern hemisphere are cooler than oceans.
- The isotherms bend towards the north (poles) when they cross the oceans and to the south (equator) when they traverse the continents because the air is warmer over the oceans than over landmasses in the northern hemisphere.
- Over the North Atlantic Oceans, this can be seen plainly. Warm ocean currents (the Gulf Stream and North Atlantic Drift) warm the Northern Atlantic Ocean, causing isotherms to bend towards the poles.
- In Europe, the temperature drops dramatically across land, and the isotherms bend towards the equator.
- The oceans have a strong influence in the southern hemisphere (due to few landmasses).
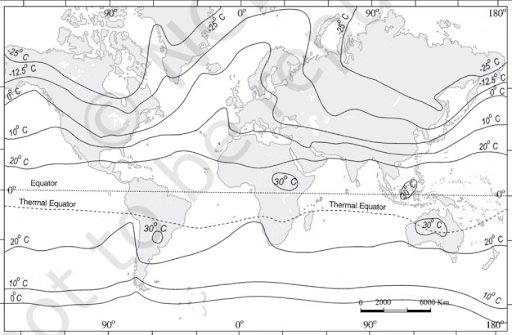
Horizontal Distribution of Temperature, Source: NCERT