The Price Puzzle: What Drives the Market
Chapter 9 | Class 9th
NCERT
Language
Choose your preferred language
The Price Puzzle: What Drives the Market
🎨 Reading Colors
Background
Text Color
Table of Contents
- Demand
- Supply
- Market Equilibrium
- Role of Government in the Economy
Demand
- As the mango season approaches, mango prices are generally high, so people buy them in smaller quantities; when prices start falling, people prefer to buy larger quantities.
- The quantity of a product that people are willing and able to buy at a particular price, depending on their needs, preferences, season, trend, and income, is called the demand for the product.
- Demand is not just the desire to buy something; it is the willingness complemented by the ability or purchasing power to buy it.
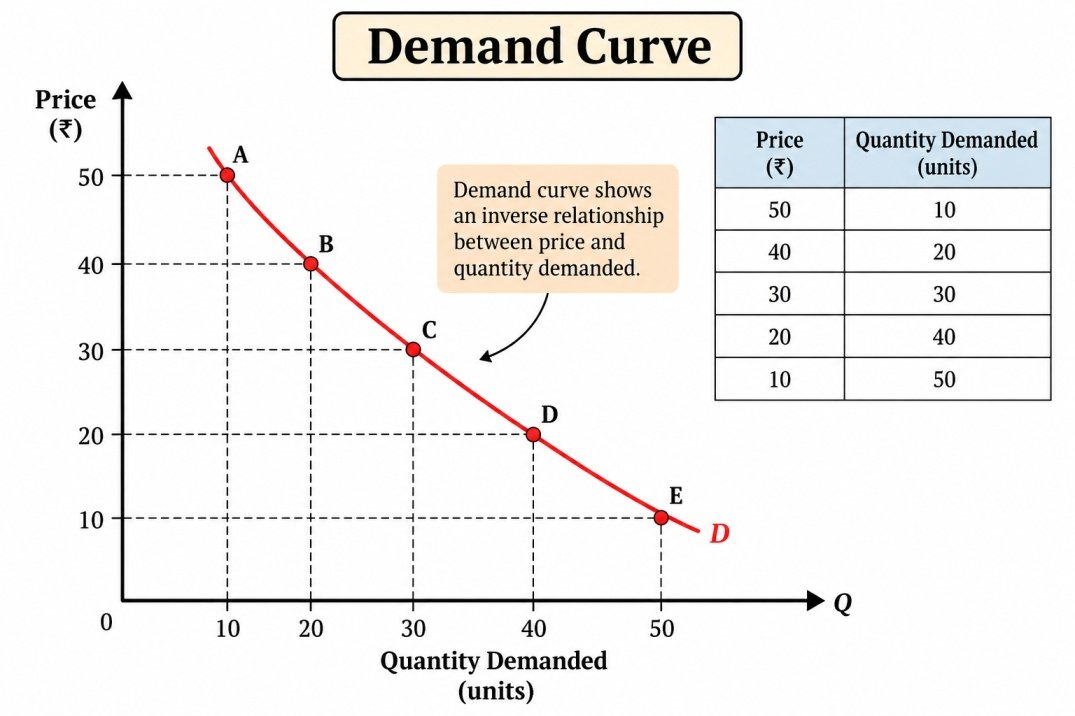
- When the price of any product rises, the quantity demanded decreases; when the price falls, the quantity demanded increases.
- This phenomenon is called the Law of Demand, which highlights the inverse relationship between the price of a product or service and its quantity demanded.
- For example, at the beginning of the mango season, when mangoes cost ₹150 per kg, Srivalli bought only 1 kg; when the price fell to ₹100 per kg, she bought 2 kg; and when the price dropped to ₹50 per kg, she bought 3 kg.
- The quantity of a good or service that an individual consumer wants to buy at different prices, keeping other factors constant, is known as individual demand.
- A table showing an individual’s demand at different prices is called a demand schedule.
| Price of Mangoes | Quantity Demanded by Srivalli |
|---|---|
| ₹150 per kg | 1 kg |
| ₹100 per kg | 2 kg |
| ₹50 per kg | 3 kg |
- When a demand schedule is represented graphically, it is called a demand curve.
- In the demand curve, the y-axis represents the price of mangoes in ₹, and the x-axis represents the quantity demanded of mangoes in kg.
- Srivalli’s purchases are represented at point A (₹150, 1 kg), point B (₹100, 2 kg), and point C (₹50, 3 kg).
- When points such as A, B, and C are connected, the downward-sloping line DD’ is called the demand curve.
- The downward-sloping individual demand curve represents the inverse relationship between price and the quantity of a product demanded by the buyer, assuming other factors such as income and taste remain constant.
- The total quantity of mangoes demanded by all potential buyers at different prices is known as market demand, which is the sum of all individual demand.
| Price | Srivalli (Q1) | Alex (Q2) | Israt (Q3) | Market Demand (QD) |
|---|---|---|---|---|
| ₹150 | 1 kg | 2 kg | 3 kg | 6 kg |
| ₹100 | 2 kg | 4 kg | 6 kg | 12 kg |
| ₹50 | 3 kg | 6 kg | 9 kg | 18 kg |
- Market demand is derived by summing the demand of all consumers, that is, QD = Q1 + Q2 + Q3.
- When market demand is plotted at different prices, we get the market demand curve DmDm’.
- The demand for a product does not change only because of its price; many other factors influence how much people want to buy, even when the price remains the same.
- The demand for a good can be affected by changes in the prices of related goods, which are of two types: substitute goods and complementary goods.
- Substitute goods can replace each other, such as tea and coffee; if coffee becomes more expensive while tea’s price remains the same, coffee consumers may switch to tea, thereby increasing the demand for tea.
- If Srivalli cannot afford mangoes at the market price, she may buy bananas; when the price of a good rises, people tend to replace it with another relatively cheaper alternative.
- Hence, if the price of a substitute good increases, the demand for the other related good will increase.
- Complementary goods are generally used together to provide utility to the consumer, such as smartphones and earphones, or cars and petrol.
- If the demand for printers increases, the demand for printer cartridges may also rise, even though the price of cartridges remains unchanged.
- Similarly, if movie tickets become more expensive, people may refrain from going to the cinema, so the demand for popcorn sold in cinema halls may also fall.
- When household income rises, consumers can afford to buy more or choose higher-quality products; a rise in income generally increases the quantity demanded for several goods, even if prices remain the same.
- Every consumer has specific tastes and preferences for certain products, which determine their demand; for example, Srivalli likes mangoes and cannot substitute them with oranges, even if oranges are cheaper.
- Demand also depends on the size and composition of a nation’s population; as the most populous nation, India’s domestic consumer demand contributes to its economic growth.
- The population’s composition shapes demand for different products and services: more children indicate increased demand for sports shoes, more working adults mean higher demand for formal shoes, and more elderly people imply higher demand for comfortable or orthopaedic shoes.
- Seasonality affects demand because individuals may demand different products at different times of the year, depending on weather, festivals, and cultural habits rather than the price of the good.
- Examples include crowded bookshops at the beginning of the new academic session, customers visiting sweet shops during the festive season, and increased demand for sweaters and jackets during winter.
- Future price expectations influence current demand even when current prices have not changed.
- If consumers expect prices to fall, they postpone purchases, decreasing present demand; if they expect prices to rise, they buy immediately, increasing present demand.
- For example, people delay buying durables before Diwali or the New Year, expecting festival discounts.